When you dig into this topic, you find tons of discussions and debates about what metrics and KPIs to use when “running” Agile and if they are helpful or misleading. This post wants to explain when and what KPIs can be used, to lead your team towards relentless improvement.
As a Scrum Master, Coach, Agile Leader, your work is to facilitate your team to grow and improve with a constant pace, sprint after sprint. In doing that, you must be as much as possible objective in measuring improvement; that’s key to drive decision making and to identify actions which lead to increase effectiveness of your team.
One of the most famous quotes of Peter Drucker says:
If you can’t measure it, you can’t improve it.
Drucker meant that unless success is defined and tracked, you never know if you reached it or not. His suggestion was to clearly establish metrics for success, then track progress and, according to that, adjust your process to produce the desired outcome. Without clear [SMART] objectives, you’re stuck in a constant state of guessing.
Another interesting quote from the American professor and statistician W. Edwards Deming says:
“In God we trust, all others must bring data.”

Yes, it definitely makes sense, too.
Actually you should know that, despite any healthy approach and endeavor in helping your teams to improve through any measures and KPIs, better results may be long in coming.
Why?! Reasons may be different:
- Fear: of changing, of making mistakes, of being judged.
- Team Dynamics: lacking of trust between team members or unaddressed conflicts.
- Transparency: unclarity about project’s vision and mission or team’s roles and responsibilities,
- Burnout: too much stress or overload.
Furthermore, we need to keep very well carved in our mind, that KPIs and measures are just proxies of the reality. Not the reality.
Ok.
Said that, KPIs could help. Let’s see a short list of them, which agile teams could use to track their progress towards improvement.
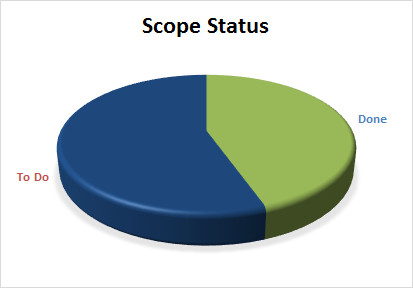
Monitoring the Scope
First of all, having a graphic view of the status of the scope in terms what has been done and not done, helps a lot.
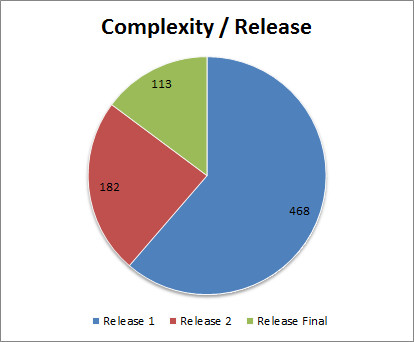
Additionally, a high level view of which part of the scope belongs to which release, is another important information. Every information contained in the product backlog is a living element, which is updated according to refinement activities as well as release planning events (which are highly recommended for complex projects).
Once your team planned for a release (usual duration from 8 to 12 weeks), you should be able to draw a Release Burndown Chart, like the following one, where the total scope for the release is reported on the Y axis against time (X Axis) and updated with actual data. This helps to see any deviation from the trend line.
In order to make forecasts for the whole product development or project duration, the tool we can use is the BurnUp Chart. This chart shows:
- A (blue) line, which represents the total scope in story points, tracked at each sprint boundary
- Histograms (green) that reports the cumulative scope burnt in story points (sum of story points accepted, velocity), for each sprint
- A (red) trend line, which projects future performance (velocity) according to past performance
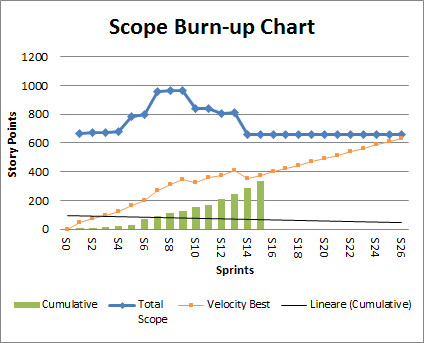
The intersection between the red line (trend) and the blue one (total current scope) gives the future sprint number, when the team completes the whole scope.
When teams want to verify the scope they work on each iteration and investigate on its nature, they could track and plot how many story points are:
- loaded into the sprint (Committed),
- added by the team in case of any discovery activites during the sprint,
- requested by the team when finished to work on the planned user stories,
- Added by PO (TO AVOID)
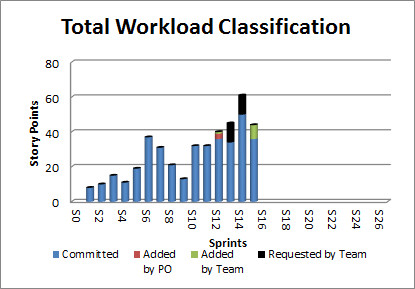
Every category (added by PO excluded) is allowed and can be considered a usual behavior. Any recurring pattern, however, is a sign that could be investigated.
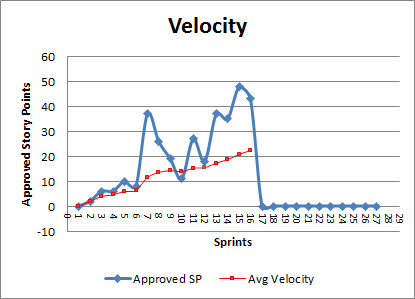
Monitoring Performance
The most utilized KPI here is the Velocity, which is the sum of the story points finished by a team (according to the Definition of Done) and definitely accepted by the Product Owner (PO), within an iteration (or sprint).
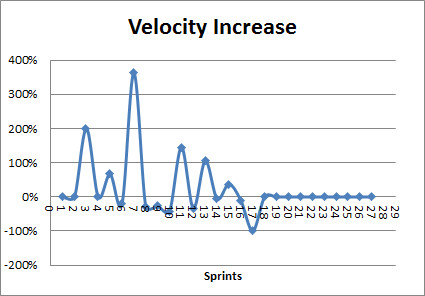
Scrum is strongly geared on the PDCA cycle from Deming. This cycle strongly stresses not only the importance of planning (P) and doing (D) activities and actions, but it helps to focus also (and foremost) on investigating (check – C) results and adapting (A) your plans/behaviors to improve.
This important concept of gathering and analyzing feedback about past iterations, is one of the pillars of the Agile Manifesto (12th Principles):
At regular intervals, the team reflects on how to become more effective, then tunes and adjusts its behavior accordingly
Scrum implements it through the Retrospective Event. Any actions which aim to improvement of produtivity, reducing of cycle time, throughput increasing, should be positively reflected by calculating the ratio between previous and current sprints velocity. The result is a percentage that can be plotted as follows.
Tracking Waste
Lean teaches us that waste must be always avoided.
In Scrum everything is built around that concept: batch dimensions (user stories and tasks) are kept small thanks to strict timeboxes (sprint, scrum events duration, etc.), Focus and Commitment are behaviors continuosly remarked and reminded (being also Scrum Values). The two roles of Scrum Master and Product Owner, help in shielding the team and clarifying responsibilities within the team. Colocation enhance communication and decrease misunderstanding, etc.
An important dynamic we would like to monitor, is that every effort spent by the team, delivers actual value for the business. What is expected, hence, is that every story finished by the team, is subsequently accepted by the Product Owner.
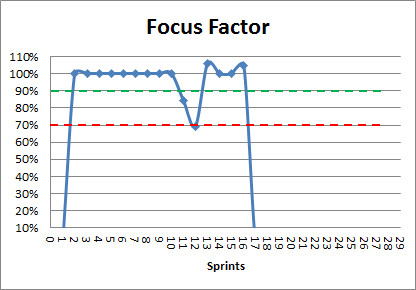
Exceptions are obviously more than welcome, but any recurring pattern must be investigated because it could hide communication problems between PO and team, difficulties with Acceptance Criteria, problems with the Definition of Done. The graph below helps in finding gaps between finished and accepted story point values.
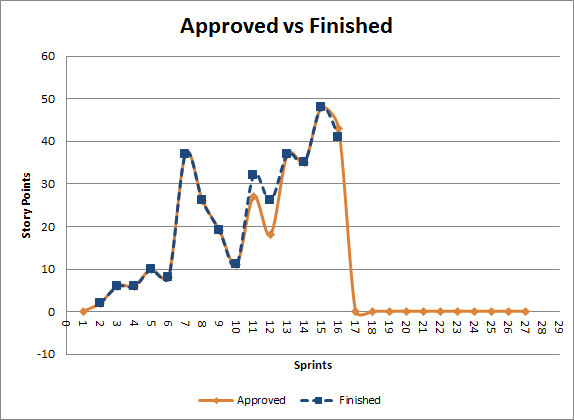
It’s possibile to generalize and represent that phenomena as absolute figures. The Focus Factor is the calculated ratio between [Finished Story Points] and [Accepted Story Points]. We can then plot those numbers for every sprint as follows:
Quality Measurement
Creating bug-free products is something we should aim to, but that is not always possibile. This means that keeping track of bugs is a mandatory practice to measure quality. We would like to measure how many new bugs have been discovered during the past iteraction, how many have beed closed and how many are still remaining.
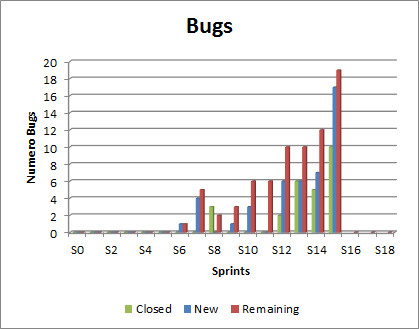
Other important measures we could track are # of Test cases and percentage of automated ones, code coverage % for unit tests, technical debt measurement through static source code analysis (see my previous post “Relentlessy avoid technical debt“).
People Engagement and Satisfaction
Last but not least, we want to measure satisfaction, motivation and engagement of people involved in Agile development.
Measuring team members’ mood is a good habit and it could be done through temperature reading just before finishing the retrospective, or by “reading” the satisfaction through Niko-niko every day.
This data can be collected and shown as KPIs over time as information radiators.
Conclusion
Finally, I like to end this post citing John Hayes:
“We tend to overvalue the things we can measure and undervalue the things we cannot.”
Thus, don’t forget we are humans largerly influenced by emotions; additionally, we, as Agilists, want to enable energy and interactions between individuals, and only then, rely on processes, tools and even on Measures and KPIs.
Safe travels :o)